Empower security teams across industries to immediately respond to risks and critical events by aggregating intelligence from many sources.

The GDA Dashboard aggregates intelligence and asset information from multiple sources for situational awareness and prioritized, coordinated responses.
A distributed workforce creates a larger risk surface, and many of threats are confined to very specific geographies. COVID-19 provided a clear example of how risk can vary dramatically, even between adjacent regions.

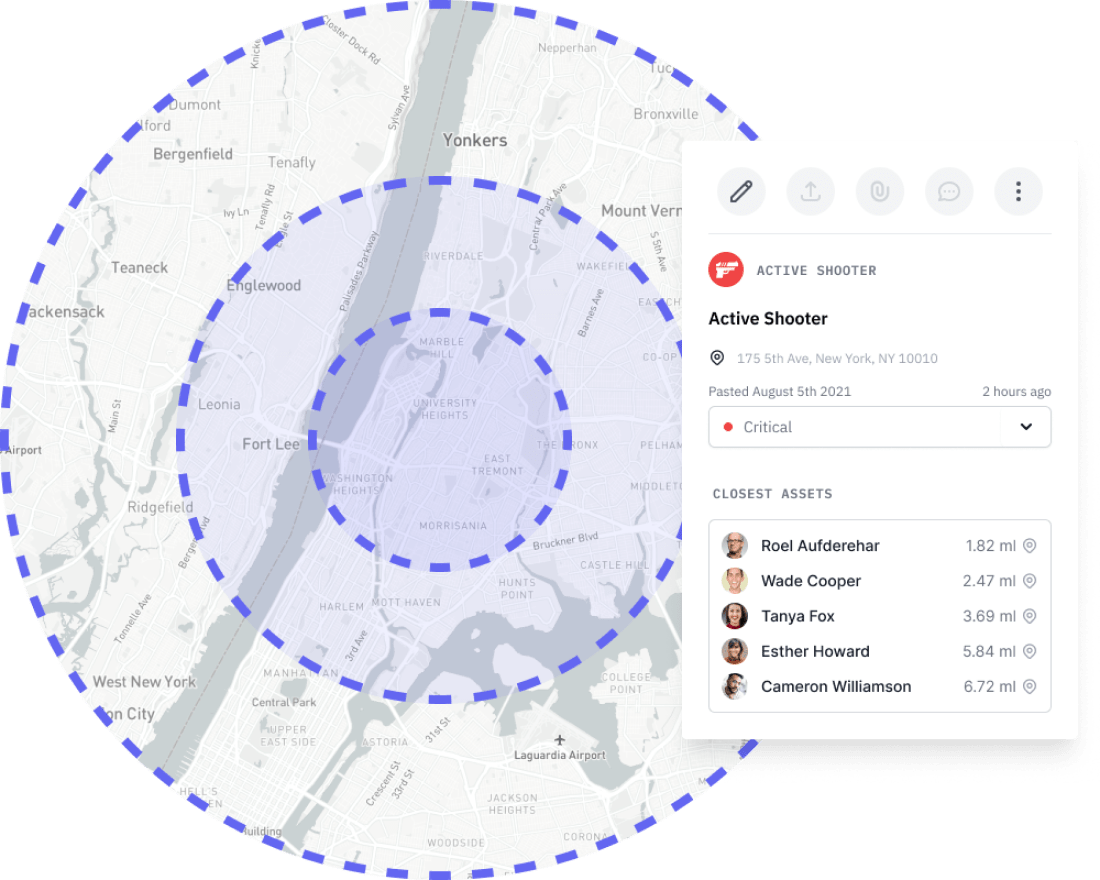
Select any alert or asset to view crucial details ranging from a storm’s severity to the location of an office’s fire escapes.

Design and share situational awareness maps based on job responsibilities, critical events, and business priorities.

This includes industry-leading visualizations of severe weather, wildfires, earthquakes, droughts, and other feeds.


GDA Dashboard provides security teams with unmatched flexibility and control over managing physical security incidents.

Using data from alerts, incidents, and operator responses, you can better assess your team’s contributions.

Understand your risk profile, whether you have a local or global footprint. See which assets have been impacted.
Create, edit, and share maps in real time. Use our platform to map anything with an address or latitude/longitude coordinates.

You can map anything with an address or latitude/longitude coordinates. Supported file types include: CSV, SHP, WKT, KML, and GeoJSON.

Build different maps based on user or group responsibilities – or specific use cases.

Security risks impact the whole organization, not just the security team. Empower everyone with the critical data.


Leverage our a high-speed rules-based data engine that ingests the right intelligence while eliminating unnecessary noise. Visualize and manage only the disruptive threats.

Not only does it ingest unlimited amounts of information, it lets you control how, where, and to whom that information is presented.

This means you can focus only on threats that potentially disrupt your operations.
Remote team members can collaborate, confirm actions, provide comments, and upload files. Entries are time stamped and audit logged to ensure a compliant and measurable response.

Critical event workflow is integrated with your common operating picture so you can assess and respond to threats in the same system.

With just a few clicks you can triage, watch, or clear alerts as needed.

We provide an audit trail to help you understand the speed and effectiveness of your responses and ensure compliance with organizational policies.

GDA Dashboard provides security teams with unmatched flexibility and control over managing physical security incidents.

This highly adaptable system supports complex incidents such as catastrophic weather events and criminal investigations.

Available as a standalone solution or fully integrated with a common operating picture
Learn how Machine Readable News can transform your trading algorithms, marketing research, and organizational decision-making.
